
Our key performance indicators (KPIs) measure the principal metrics that we focus on to run the business, and they, along with the key measures that drive them, help determine how we are remunerated. Over the longer term, we aim to outperform our benchmarks through successfully executing our strategy. Over the last 12 months, the challenging macroeconomic environment impacted absolute property returns and real estate share prices. However, our strong operating performance helped us outperform many of our benchmarks.
Total Shareholder Return % (TSR)
Total Shareholder Return % (TSR)

Rationale
TSR is a standard measure of shareholder value creation over time. It measures the movement in a company’s share price plus dividends expressed as an annual percentage movement.
Commentary
TSR of the Group has been benchmarked against the TSR of the FTSE 350 Real Estate Index (excluding agencies). The TSR of the Group was -21.3%1 for the year, compared to +10.7% for the benchmark given improved investor sentiment for non-office based real estate companies.
Alignment with remuneration: All, LTIP
1On a spot basis
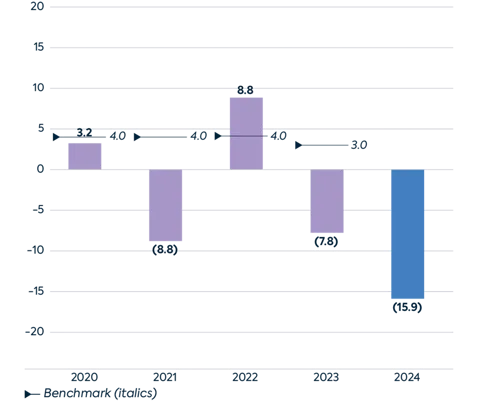
Total Accounting Return % (TAR)
Total Accounting Return % (TAR)
Rationale
TAR is measured as absolute EPRA NTA per share growth (the industry standard measure of a real estate company’s success at creating value) plus any ordinary dividends paid, expressed as a percentage of the period’s opening EPRA NTA.
Commentary
TAR was -15.9% for the year. The TAR performance was driven by the impact of elevated interest rates on the property valuation.
Alignment with remuneration: All, LTIP and Exec Bonus2
2For the 2023/24 Annual Bonus, TAR per share is benchmarked against the relative performance of the FTSE 350 Real Estate Index (excluding agencies). While a number of companies are yet to publish their financial results, we anticipate that our TAR for the year underperformed the Index due to the comparatively stronger performance of other real estate sectors.
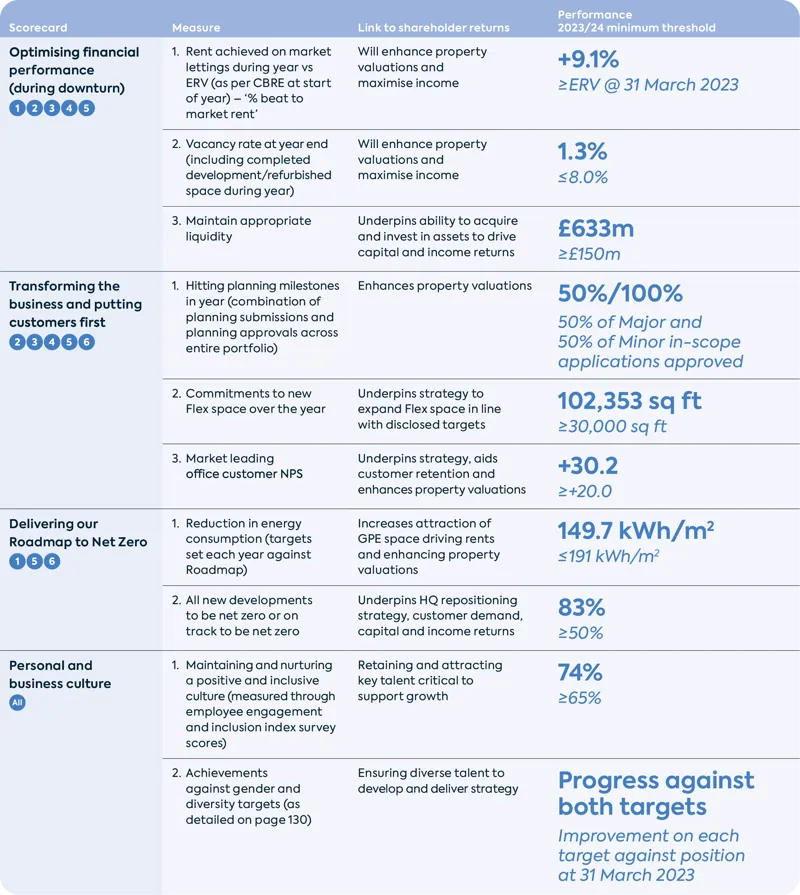
Revised KPIs for 2023/2024
As explained in last year’s Annual Report, given the macro-economic backdrop, the Group has moved to a more target-based operational scorecard under the revised Directors’ remuneration policy approved by shareholders at the 2023 Annual General Meeting. The scorecard is designed to motivate management to optimise returns for shareholders by focusing on clear and measurable objectives to deliver our strategic priorities. Each of the measures is designed to directly or indirectly drive our financial KPIs and shareholder value in the longer term and form an integral part of the revised Directors’ remuneration policy to align performance and executive remuneration.
Our KPIs are driven by our strategic priorities
1 - Progress sustainability and innovation agenda
2 - Enhance portfolio through sales and acquisitions
3 - Deliver on our Flex ambition
4 - Embed our ‘Customer First’ approach
5 - Deliver and lease the committed schemes
6 - Prepare the pipeline
All - All six priorities